Departmental Standards
Company-Wide
eCornell Styleguide & Branding
Cornell University Branding
Writing and Editing Style Guide
Faculty and Expert Naming Conventions in Courses
Cornell School and Unit Names
Tips for Campus Engagements
LSG
Legal Policies
CSG
Updating Wrike Due Dates
Photography Style Guide
eCornell Mini Visual Style Guide
The Pocket Guide to Multimedia Design Thinking (*as It Pertains to Your Job Here)
Creative Services (CSG) Handbook
Administrative
LSG Meeting Recordings and Notes
Sending Faculty Sign-Off Forms in Adobe Sign
Weekly Faculty Status Emails
Animation/Motion Design
Instructional Design
Required Course Elements
AI in Instructional Design: Principles and Approach
The Pocket Guide to Instructional Design Thinking at eCornell
Adding AER to Canvas
Grading
D&D Newsletter
LSG Newsletter (LSGN) - February 2024
LSG Newsletter (LSGN) - March 2022 Edition
LSG Newsletter (LSGN) - December 2023
LSG Newsletter (LSGN) - October 2021 Edition
LSG Newsletter (LSGN) - June 2022 Edition
D&D Newsletter November 2024
LSG Newsletter (LSGN) - August 2022 Edition
LSG Newsletter (LSGN) - June 2023
LSGN Newsletter April 2023
LSG Newsletter (LSGN) - February 2022 Edition
LSG Newsletter (LSGN) - October 2022 Edition
LSGN Newsletter February 2023
LSGN Newsletter March 2023
D&D Newsletter September 2024
LSG Newsletter (LSGN) - August 2023
LSG Newsletter (LSGN) - March 2024
LSG Newsletter (LSGN) - April 2022 Edition
D&D Newsletter - August 2024
LSGN Newsletter January 2023
LSG Newsletter (LSGN) - October 2023 article
LSGN Newsletter (LSGN) - April 2024
LSG Newsletter (LSGN) - November 2021 Edition
D&D Newsletter February 2025
LSG Newsletter (LSGN) - January 2022 Edition
LSGN Newsletter December 2022
D&D Newsletter April 2025
LSG Newsletter (LSGN) - July 2022 Edition
LSG Newsletter (LSGN) - September 2022 Edition
Course Development
Image Uploads for Inline Projects
How to Install the Firefox Canvas Utilities Extension
Revising a Course/ Creating a Redux Version/ Course Updates
Creating a Perma Link With Perma.cc
Course Content Deletion Utility — Removing All Course Content
Course Names
Requesting High Resolution Video Uploads
Technical Talking Points Template
Writing Discussions: Guidelines for IDs
Online Resources in Credit-Bearing Courses
Hiring Actors for an eCornell Project
Marketing
Operations
Tech
Master Course Template Differences (8675309s)
FeedbackFruits Overview
Non-CSG File Uploads
Mentored Learning Conversion Process and Resources
Doc-Based Master Course Template and Standards (8675309-DOC)
Pedagogical Guidelines for Implementing AI-Based Interactives: AER
New Canvas Accounts for Faculty Partners
Coding Master Course Template and Standards (8675309-CODE)
FeedbackFruits Implementation
Practice Quiz Standards
Hero Image
Platform Training
Administrative Systems
ADP
Google Drive
Downloadables Process
Embed a Document From Google Drive
Adding Google Links to Canvas
File Naming and Storage Convention Standards
Google Drive for Desktop Instructions
Storing Documents in Multiple Locations
Wrike
Wrike System Fundamentals
Field Population
1.0 to 2.0 Wrike Project Conversion
Blocking Time Off in Work Schedule (Wrike)
Wrike Custom Field Glossary
Wrike "Custom Item Type" Definitions
How to Create a Private Dashboard in Wrike
Using Timesheets in Wrike
Importing Tasks into a Wrike Project
Wrike Project Delay Causes Definitions
Setting OOO Coverage for Roles in Wrike
How to Change a Project's Item Type in Wrike
Using Search in Wrike
How to Create a Custom Report in Wrike
@ Mentioning Roles in Wrike
Automate Rules
Using Filters in Wrike
Managing Exec Ed Programs in Wrike
External Collaborators
Wrike for External Collaborators: Getting Started
Wrike for External Collaborators: Views
Wrike for External Collaborators: Tasks in Detail
Wrike Updates
New Experience Update in Wrike
Wrike Course Development Template 2.0 - What's New
Wrike - Course Development Template 3.0 Release Notes
Wrike Process Training
Course Development & Delivery Platforms
Canvas
Development
Adding Custom Links to Course Navigation
Adding Comments to PDFs from Canvas Page Links
Setting Module Prerequisites and Requirements in Canvas
Canvas Page Functionality
Create a New Course Shell From 8675309
Using LaTeX in Canvas
Search in Canvas Using API Utilities - Tutorial
Reverting a Page to a Previous Version
Student Groups
Create Different Canvas Pages
Importing Specific Parts of a Canvas Course
Canvas HTML Allowlist/Whitelist
Understanding Canvas Customizations/Stylesheets
Operations
Discussion Page Standards
How to import a CU course containing NEW quizzes
Canvas LMS: NEW Quiz compatibility
Faculty Journal
Course Content Style Guide
Click-To-Reveal Accordions in Canvas
Course Maintenance Issue Resolution Process
Meet the Experts
Codio
Codio Operations
Managing Manually Graded “Reflect and Submit” Codio Exercises
Codio Structure and Grading for Facilitators
Premade Codio Docs for Ops & Facilitators
Codio Remote Feedback Tools for Facilitators
Developers
Development Processes
Creating a New Codio Course
Creating a New Codio Unit
Integrating a Codio Course into Canvas Using LTI 1.1
Embedding a Codio Unit into Canvas
Setting Up the Class Fork
Jasmine Autograde Unit Testing
Setting Up the Class Fork (LTI 1.3)
R Studio - Exclusion List for R Code
Mocha/Selenium Autograding
Starter Packs in Codio
Configuring Partial Point Autograders in Codio
Launch a Jupyter Notebook from VM
AI Extensions
Program-Specific Developer Notes
Codio Functionality
Jupyter Notebooks
Jupyter Notebooks - nbgrader tweaks
Jupyter Notebooks Style Guide
Creating NbGrader Assignments
Adding Extensions to Jupyter Notebooks
Setting up R with Jupyter Notebooks
Change Jupyter Notebook Auto Save Interval
How to Change CSS in Jupyter Notebook
RStudio in Codio
How To Centralize the .codio-menu File to One Location
Codio Fundamentals for LSG
Using the JupyterLab Starter Pack
Using Code Formatters
Using the RStudio Starter Pack
Conda Environments in Codio
Updating Codio Change Log
Codio Basics: Student Support
eC Facilitator Guide to Codio
Migrating to Updated Codio Courses
Qualtrics
Ally
Adobe
Other Integrations
Pendo Overview
How to Add VitalSource eBooks in Canvas
Enabling Zoom/"Live Sessions" in a Course
Pendo Guide Creation
H5P
Modifying Subtitles in H5P Interactive Videos
Embedding H5P Content Into Canvas
Troubleshooting H5P Elements in Canvas
Inserting Kaltura Videos into H5P Interactive Videos
Adding Subtitles to H5P Interactive Videos
S3
BugHerd
Instructional Technologies & Tools Inventory
Canvas API Utilities
Getting started with the MOP Bot
eCornell Platform Architecture
HR & Training Systems
Product Development Processes
Accessibility
What Is Accessibility?
What Is Accessibility?
Accessibility Resources
Accessibility Considerations
Accessibility Support and Assistive Technology
Structural Accessibility
Accessibility Design and Development Best Practices
Accessible Images Using Alt Text and Long Descriptions
Accessible Excel Files
Accessibility and Semantic Headings
Accessible Hyperlinks
Accessible Tables
Creating Accessible Microsoft Files
Mathpix: Accessible STEM
Design and Development General Approach to Accessibility
Integrating Content Authored by a Third Party
Planning for Accessible Tools
Accessibility Considerations for Third Party Tools
Studio Accessibility
Designing for Accessible Canvas Courses
Accessibility: Ongoing Innovations
Course Development
Planning
Development
0. Design
1. Codio Units
1. Non-Video Assets
3. Glossary
4. Canvas Text
4. Tools
4. Tools - Wrike Task Definitions
3. Review And Revise Styled Assets
ID/A to Creative Team Handoff Steps
General Overview of Downloadables Process
Course Project: Draft and Final
Excel Tools: Draft and Final
eCornell LSG HTML Basics
1. Non-Video Assets - Wrike Task Definitions
2. Video
Multifeed Video
2. Video (Standard) - Wrike Task Definitions
Studio Tips
Tips for Remote Video Recording Sessions
Who to Tag for Video Tasks
3. Animation
3. Animation - Wrike Task Definitions
2. Artboard Collab Doc Prep
6b. Motion Design Review and Revise
Who to Tag for Animations Tasks
3. Artboard Collab Process Walkthrough
DRAFT - FrameIO Process Walkthrough
Motion Contractor Guide for IDAs / IDDs
Requesting / Using Stock Imagery (Getty Images and Shutterstock)
3. Ask the Experts
5. On-Demand Conversion
5. Review
5. Review - Wrike Task Definitions
1. Prep Course for Reviews
3. Implement Creative Director Edits
3. Implement IDD Edits
4. CSG - Revise Tools Export 1
5. Conduct Faculty Review
6. Implement Faculty Edits
7. Conduct Technical Review of Course (STEM-only)
Technical Student Experience (Tech SE) Review Process
2. Conduct IDD or Sr ID Review
6. Alpha
6. Alpha - Wrike Task Definitions
Alpha Review Process
Prepare a course for Alpha review
Schedule & Conduct Alpha Triage Meeting
7. QA
7. QA - Wrike Task Definitions
1. Prep Course for QA
2. Copy Edit Captions
2. Copy Edit Course & Files
4. Conduct Content QA of Course
4. Final Creative Review and Export
Adding Chat With Tech Support to Course Navigation
5. Implement QA Edits
Working With Video Captions That Contain Special Characters
Copy Edit Captions in SubPLY
Creating a Course Style and Settings Guide
Copy Editing Content in Frame.io
1. Complete Dev to QA Checklist
Copy Edit Captions in 3Play
Tag a Video for Transcription by 3Play
Course QA Checklists
8. Deployment
8. Deployment - Wrike Task Definitions
1. Finalize Master Version of Course
2. Create & Add Course Transcript (CT) to Course
Replace a Master -M With a Redux Version of the Course
3. Create -T (Training Course) and Associate With Master Blueprint
Canvas Blueprint Course Functionality
Project Management in Wrike
Managing Project Reporting in Wrike
Managing Task Needs/Schedule in Wrike
Adding Tasks
Comments and Communication
Statuses
Updating Task Start and Due Dates
Predecessors
Durations
Rollups
Calculating Project Schedule by Deadline in Wrike
Creating Course Project Plans in Wrike
Setting Custom Capacity for Resources
Customizing Effort in a New Project Plan
Marking Projects Complete in Wrike
How to Set Up Workload Charts to Track Effort in Wrike
For-Credit Considerations
1-Sheet Population
Post-Development
AI Simulations
Program Facilitation & Operational Guidelines
Data Science
Facilitator Resources
Canvas Navigation
Adding Events to the Course Calendar
Navigating Canvas and the Dashboard
How Do I View Previous Courses I Have Taken or Facilitated?
Why Am I Receiving Duplicate Canvas Emails?
How Do I Edit My Canvas Profile?
Send Students a Direct Message on Canvas
Adding Notes to Canvas Gradebook
How Do I Send Students Nudges from the Gradebook?
Overview of 2024 Changes- Course Layout and Structure
How Can I Update My Canvas Notification Preferences?
Ursus Navigation
How Do I Access My Offer in Ursus?
How Do I Edit My Ursus Profile?
How Do I Request Time Off (Blackout Dates)?
How Can I Request to Learn More Courses?
Live Sessions
Enabling Student Use of Closed Captioning in Zoom
When Should I Schedule My Live Sessions For?
Changing Live Session Date and Time After Created with Facil Tool
Help! I Need to Reschedule a Live Session
Live Session Information page
Set up Live Sessions with the Facil Tool
Combining Live Sessions with Facil Tool
Course Set-Up
Course Set Up: Getting Ready for Live Sessions
Recording and Posting a Welcome Video
Course Set Up: When can I begin to edit my course?
Automated Nudge Feature Guide
Course Set Up: Reviewing Due Dates
Course Set Up: Reviewing Announcements
What Do I Need to Do to Make Sure My Course is Set Up Correctly?
Blurring Background During Video Feedback with the Speedgrader
How Do I Customize My Course Sections?
Course Announcements and Messages Templates
Facilitator Focus
Zoom and other Technical Support
Reporting Spam/Phishing
How Do I Set Up My Zoom Account?
Support Resources for Facilitators
Common Access/Login Errors
Live Session/Zoom Trouble Shooting Guide & Technical Readiness
How to Upload Videos to Zoom On-Demand
Student Survey FAQs
How Do I Save and Refer Back to Zoom Recordings?
How Do I Find My Personal ID Meeting link in Zoom?
Benefits as an eCornell Employee
Do I Have Access to Microsoft Office as a Cornell Employee?
Taking Courses as a Student
Professional Development Benefit
Student Success
Help! My Students Can't View a Video Within My Course
Identifying Learner Story & Testimonial Opportunities
Extensions and Retakes
Policies and Navigation Resources for Students
Symposium Access Extension- Fall 2025
Students enrolled through special groups: Corporate and VA
Unique Circumstances for Student Extensions and Retakes
Communicating with Students via Canvas
Can I Provide Students with a Letter of Recommendation?
Understanding and Addressing Instances of Plagiarism
Support Resources for Students
Understanding and Addressing Use of AI
Help! My Student is Having a Hard Time Uploading a Video
Unique Student Situations
I Have a Student Requesting Accommodations- How Should I Proceed?
Canvas Mobile App
Messaging Students via the Canvas Mobile App
Setting up and Navigating the Canvas Mobile app
Setting up Push Notifications on Canvas Mobile
Canvas App Features for eCornell courses
New Facilitator Onboarding and Quick References
Facilitator Onboarding at eCornell
Why Do I Have Multiple eCornell email and Canvas Accounts?
Quick reference: Systems and Accounts we use at eCornell
Quick reference guide: Key eCornell Personnel
How do I Log Onto Canvas and Access FACT101?
How Do I Add eCornell to My Email Signature?
Training Course Review & Facilitation Authorization
What to Expect During Live Shadowing Experience
Setting up Email Forwarding
Facilitator Expectations and Grading Help
Changes in Grading Scheme: Incomplete/Complete and 75% to 85%
New (Embedded/Inline Format) How do I grade Course Projects?
Navigating the Gradebook and Accessing the Speedgrader
Quick Reference: Sort assignments in the Speedgrader
How do I Grade Quizzes?
(Old format) How Do I Grade Course Projects and Add Annotations?
Rubrics for Effective Facilitation
Is There an Answer Key for my Course?
How to Monitor and Promote Student Progress
How Do I Grade Discussions?
Adding an Attempt to a Course Project
How Quickly Do I Need to Provide Grading to Students?
Payroll and the Monthly Scheduling Process
Codio References
Manually Graded “Reflect and Submit” Codio Exercises
Codio Quick Resources
Codio Reference: Embedded quiz questions (H5P)
Codio Reference: Checking for Completion Status
Codio Reference: Manually Graded Exercises
Codio Reference: Finding Solution Code in Codio Courses
Codio Remote Feedback Tools
Codio Reference: Ungraded exercises
Codio Reference: Autograded Exercises
Archived
Table of Contents
- Overview & Purpose
- Resources
- Where Behavioral Insights Is (and Isn't) Available
- How to Turn On Behavioral Insights
- How to Access Behavioral Insights (Facilitator View)
- Example 1 - Honest Work (No Plagiarism Detected)
- Example 2 - Plagiarism Pattern
- Using BI for Plagiarism Review
- False Positives: JupyterLab & RStudio
- Behavior Comparison Table
- All Categories
-
- Behavioral Insights: ITG Reference & Setup Guide
Behavioral Insights: ITG Reference & Setup Guide
 Updated
by Jason Carroll
Updated
by Jason Carroll
- Overview & Purpose
- Resources
- Where Behavioral Insights Is (and Isn't) Available
- How to Turn On Behavioral Insights
- How to Access Behavioral Insights (Facilitator View)
- Example 1 - Honest Work (No Plagiarism Detected)
- Example 2 - Plagiarism Pattern
- Using BI for Plagiarism Review
- False Positives: JupyterLab & RStudio
- Behavior Comparison Table
Overview & Purpose
Behavioral Insights (BI) is a Codio feature that surfaces student behavior patterns during coding assignments. It's useful for two distinct things:
- Technical investigation - spotting patterns that point to assignment, code, or platform issues.
- Instructional support - flagging potential plagiarism or student struggle so facilitators know where to look closer.
Resources
Codio documentation
Canvas course: Codio Behavioral Insights Test
Where Behavioral Insights Is (and Isn't) Available
BI tracks keystroke-level activity inside the native Codio IDE. It does not reliably track activity in:
- JupyterLab
- CodioStudio / RStudio
When a course or unit uses Jupyter or CodioStudio instead of the base Codio IDE, BI either shows no data or throws a false-positive flag (red/orange indicator) - because the absence of tracked keystrokes looks, to the system, like the absence of work. See False positives below.
Course-level vs. unit-level
BI is enabled at the course level, not per unit. Some courses are "split" - part of the course uses the base Codio IDE, part uses Jupyter, within the same course. In those cases, turning BI on still applies it course-wide, so be aware it'll surface false positives for the Jupyter/CodioStudio portions even if the IDE portions are clean.
Coverage matrix
There's a shared spreadsheet showing, by district, which courses currently have BI turned on (highlighted green).
View the BI coverage matrix
Check this matrix before enabling BI for a new district/course - and update it when you toggle BI for a course.
How to Turn On Behavioral Insights
In Codio, for a given course:
- In the left-side nav, under Grading, click Basic Settings.
- Under Behavioral Insights Options, toggle on Enable Behavioral Insights.
- (Optional) Adjust threshold options in the same section if defaults don't fit the course.
Remember: this is a course-level toggle. Confirm the course (or the relevant portion of it) uses the base Codio IDE before turning it on - see Where BI Is Available above.
How to Access Behavioral Insights (Facilitator View)
This is what facilitators will see once BI is on - useful for ITG to know so we can troubleshoot or walk someone through it.
- Navigate to the course in Canvas.
- Open the Overview tab in the left-side nav.
- Go to the Progress tab.
- Locate the Behavior column.
- Click the indicator next to a student's entry to open the BI panel for that student.
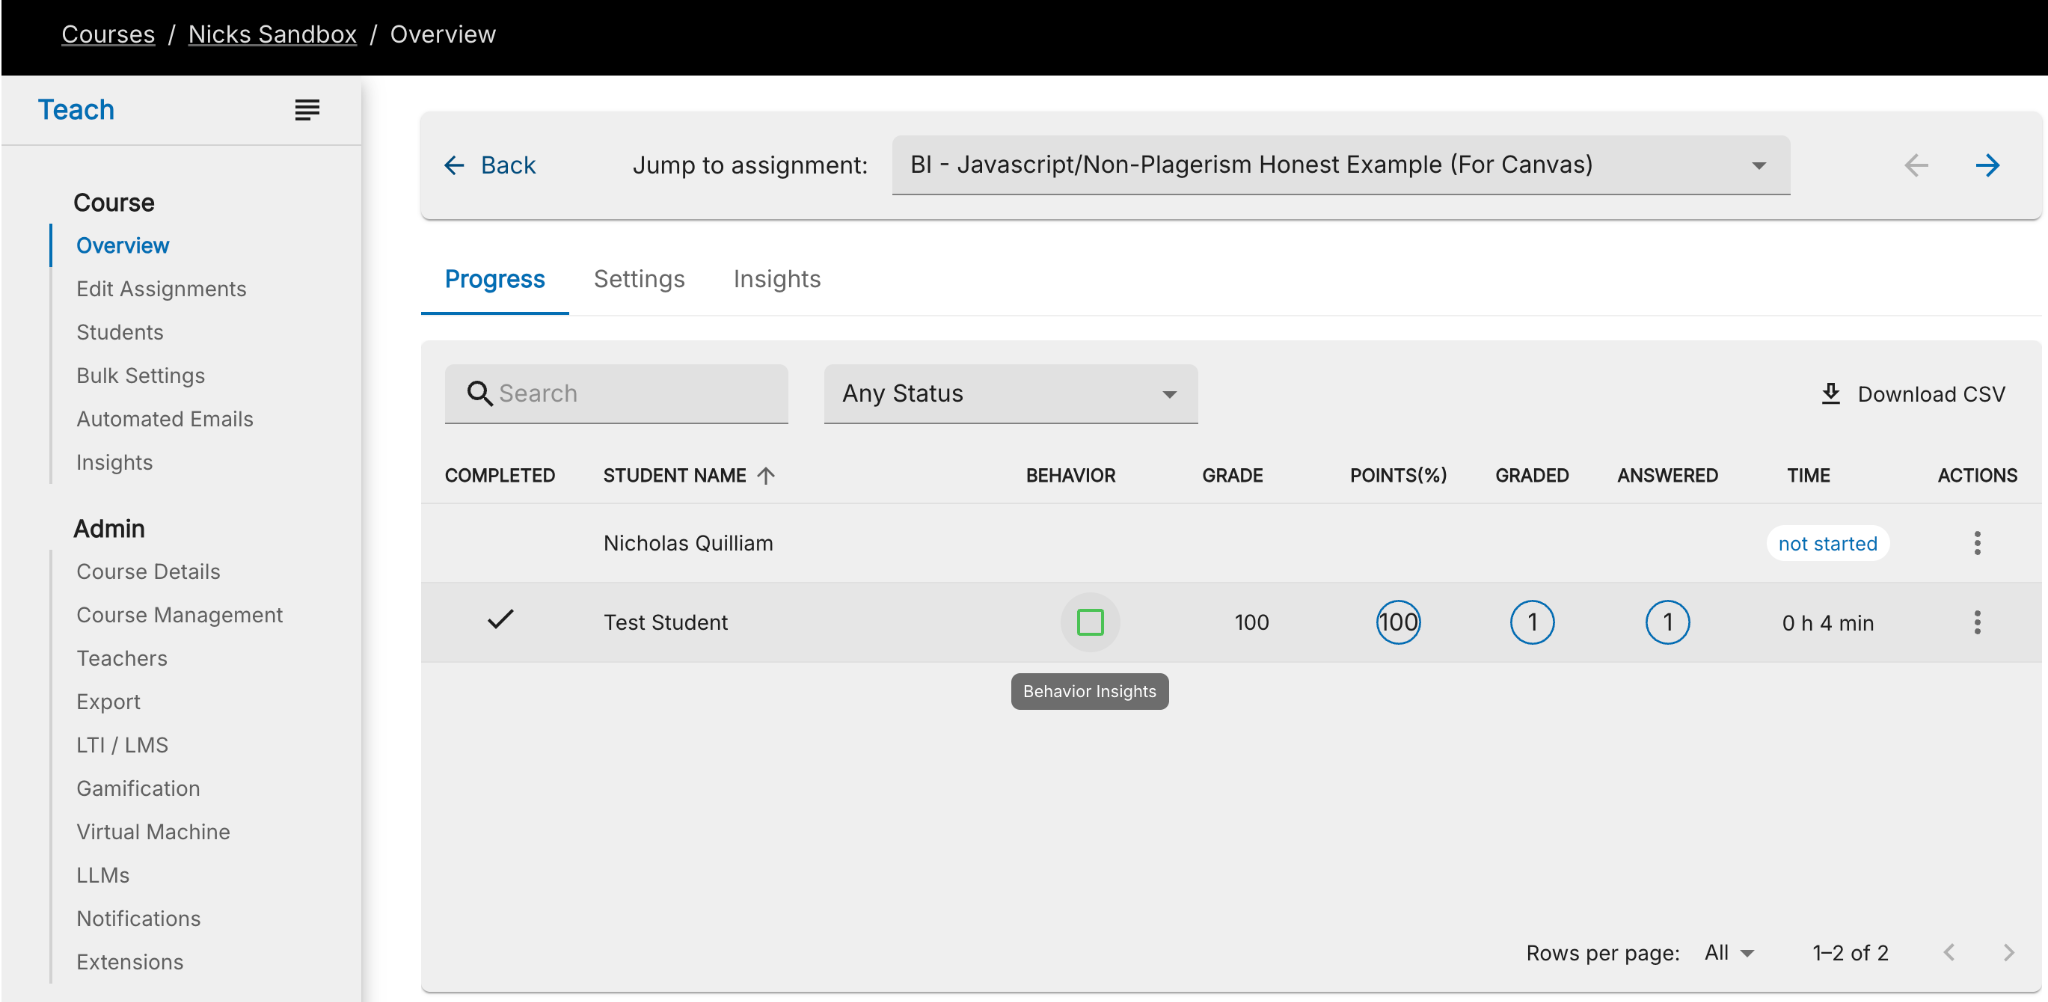
Figure 1 - Accessing Behavioral Insights from the Canvas Progress tab
Indicators and thresholds
The Behavior column uses a four-color indicator system based on configurable thresholds (configured at the course level):
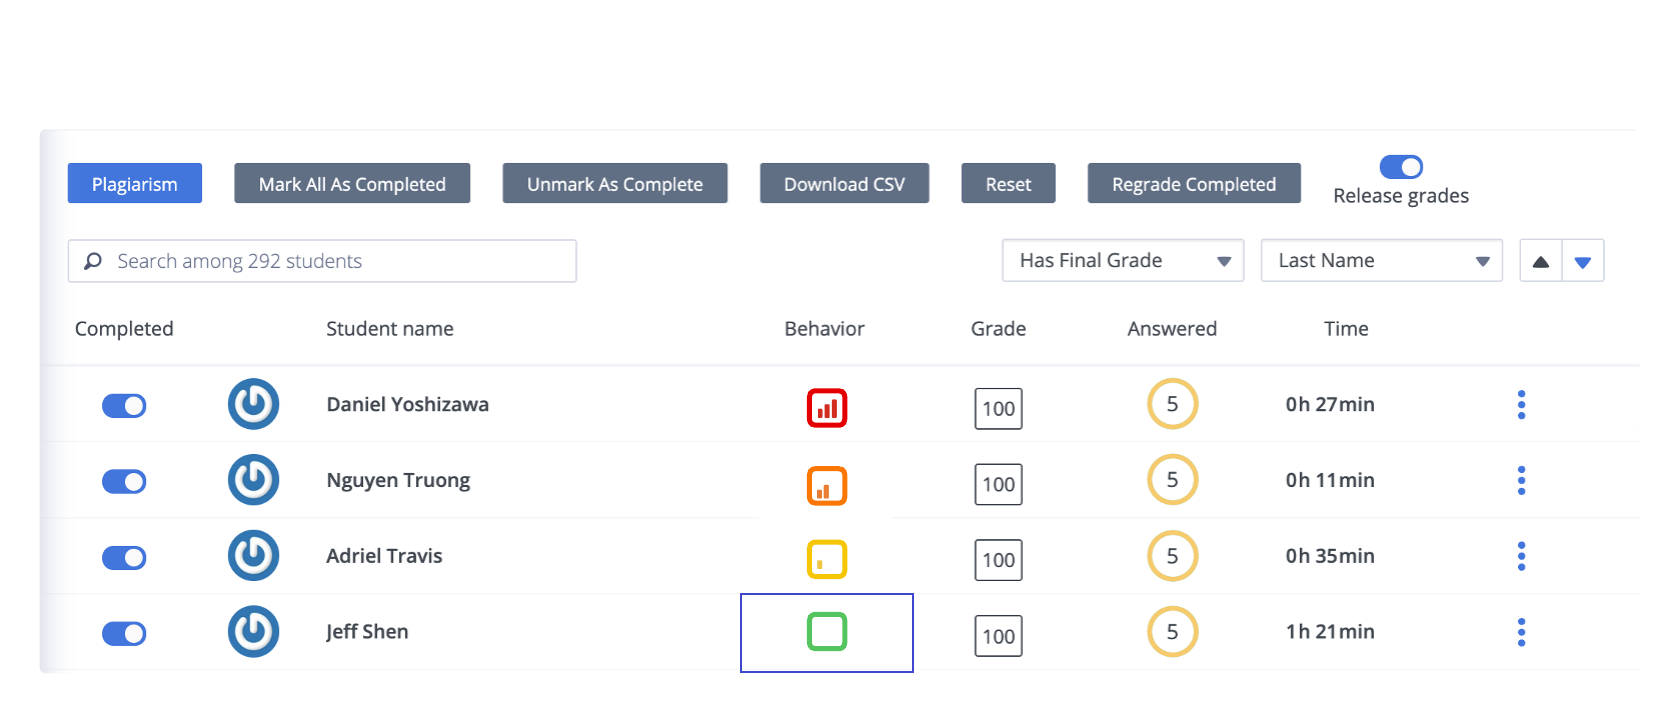
Figure - Behavior column indicators: green (no thresholds broken), yellow/orange (one or more thresholds approaching or broken), red (thresholds clearly broken)
An empty/green indicator means no configured thresholds were broken. When thresholds are broken, the affected tiles inside the BI dashboard get a red outline, dashed threshold lines, and explanatory text under each chart.
Per Codio's documentation: low time spent combined with a high edit rate can indicate potential plagiarism concerns, while high time spent combined with a very low edit rate can indicate possible student struggle.
Example 1 - Honest Work (No Plagiarism Detected)
Assignment: BI - Javascript/Non-Plagerism Honest Example (For Canvas)
This example shows a normal, honest attempt - no plagiarism indicators, in the native Codio IDE.
BI metrics
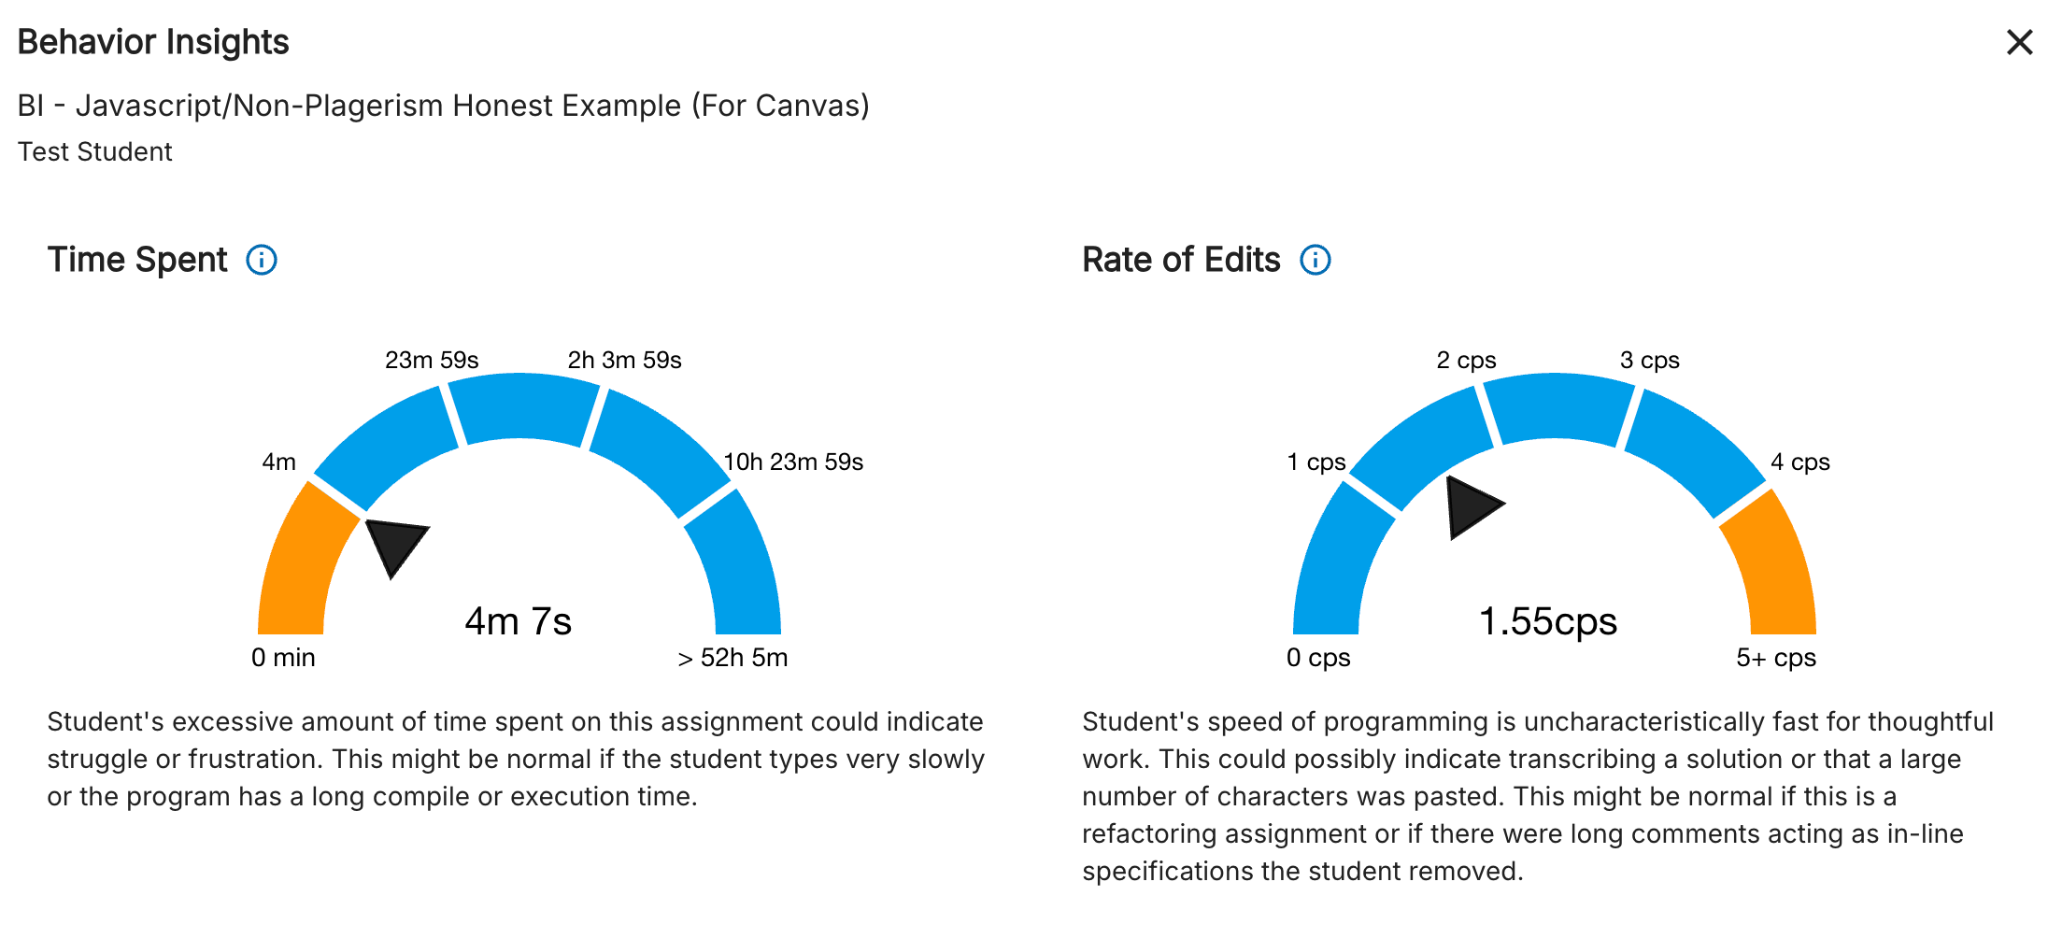
Figure 2 - Time Spent and Rate of Edits, honest-work example
Time spent: 4 minutes 7 seconds - short, but plausible for a simple exercise. Rate of edits: 1.55 characters per second - a normal typing range, not suggestive of a large block being pasted in at once.
Together, these don't raise flags. They suggest active writing and editing, not a one-time drop-in of a finished solution.
Coding behavior breakdown
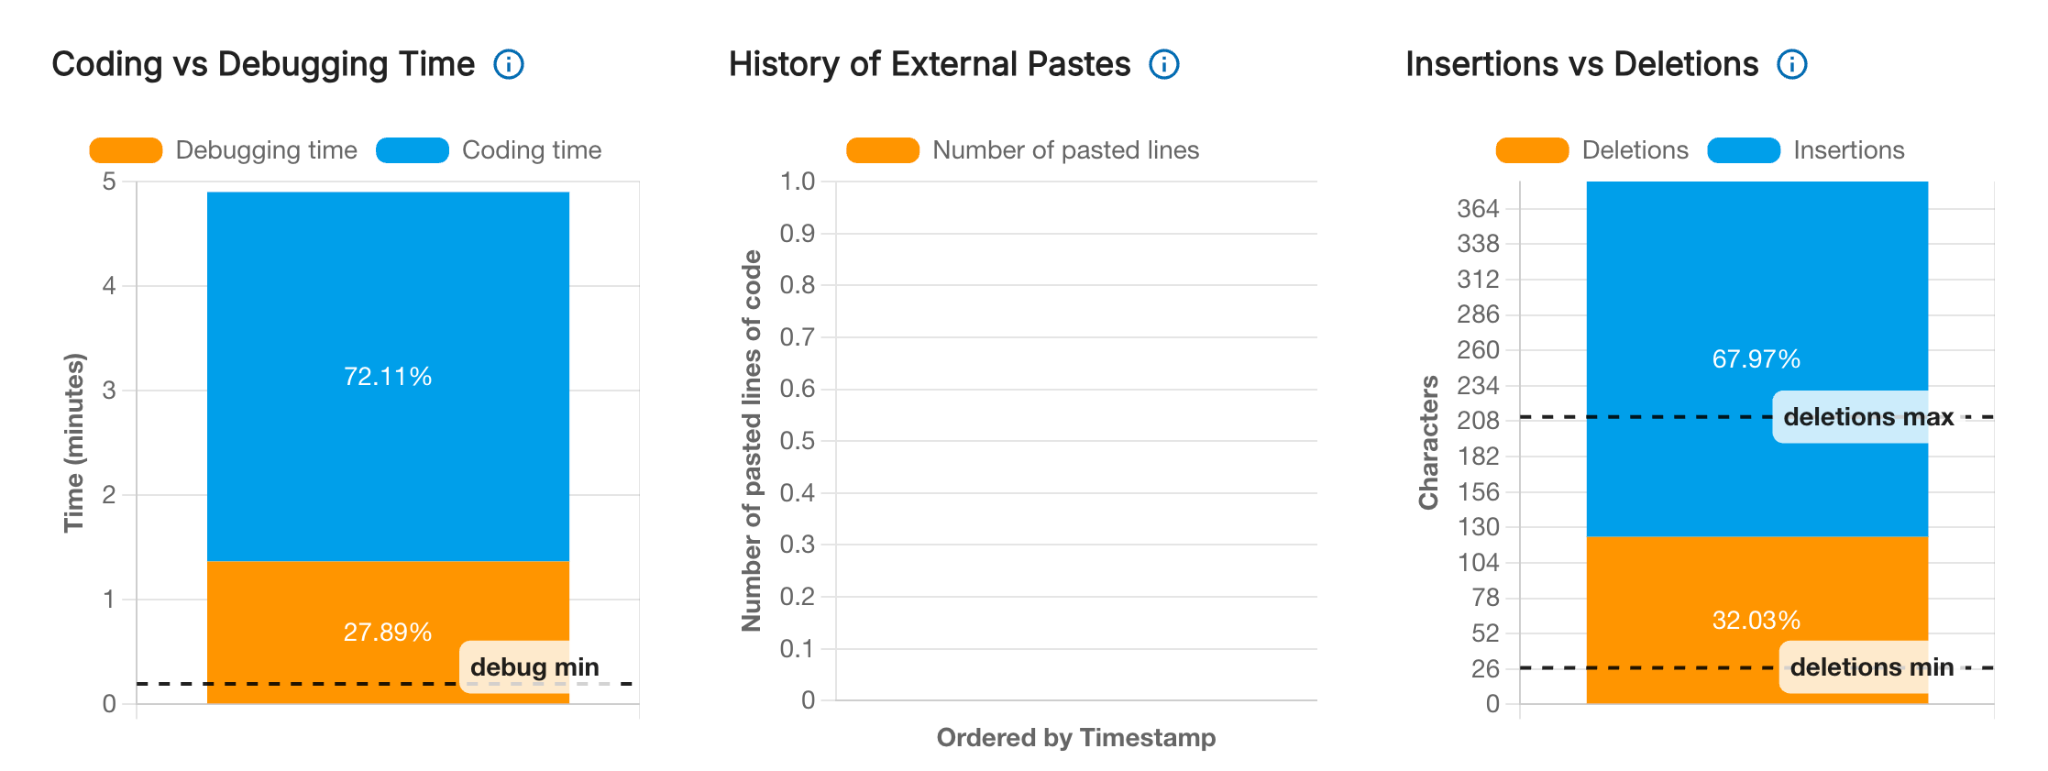
Figure 3 - Coding vs. debugging time, external paste history, insertions vs. deletions
The coding-vs-debugging split looks realistic. The History of External Pastes chart is empty - an important signal, since there's no recorded external paste event at all. Insertions vs. deletions also looks like normal iterative work (add code, then revise).
External paste tile and link to playback
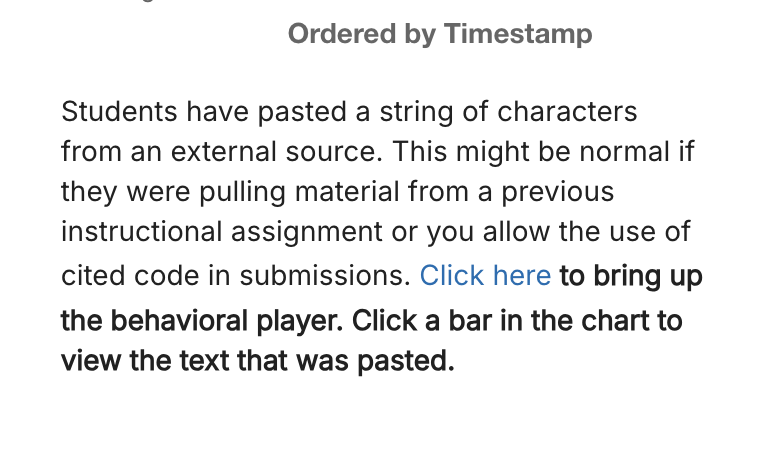
Figure 4 - External paste tile text and link to the behavioral player
From this tile, click "Click here" to open the behavioral player - a time-based replay of the student's work. In this honest example there's no suspicious paste pattern, but the player is still useful to verify the work was built progressively.
Behavioral player / code playback
Figure 5 - Behavioral player: code playback and activity timeline
Key rows/controls in the player:
- File name - which file was being changed over time.
- Pastes - where paste events occurred over time.
- User events - actions like clicking "Check It" (test-code button).
- Timeline - date/time of activity.
- Playback controls (lower-left) - step backward, play step-by-step, step forward.
The top code pane shows the contents of the selected file; the timeline beneath shows how the work unfolded. For an honest attempt, this helps confirm the code appeared gradually and testing happened at sensible points.
Example 2 - Plagiarism Pattern
Assignment: BI - Javascript/Plagerism Example (For Canvas)
Strong indicators of copied work.
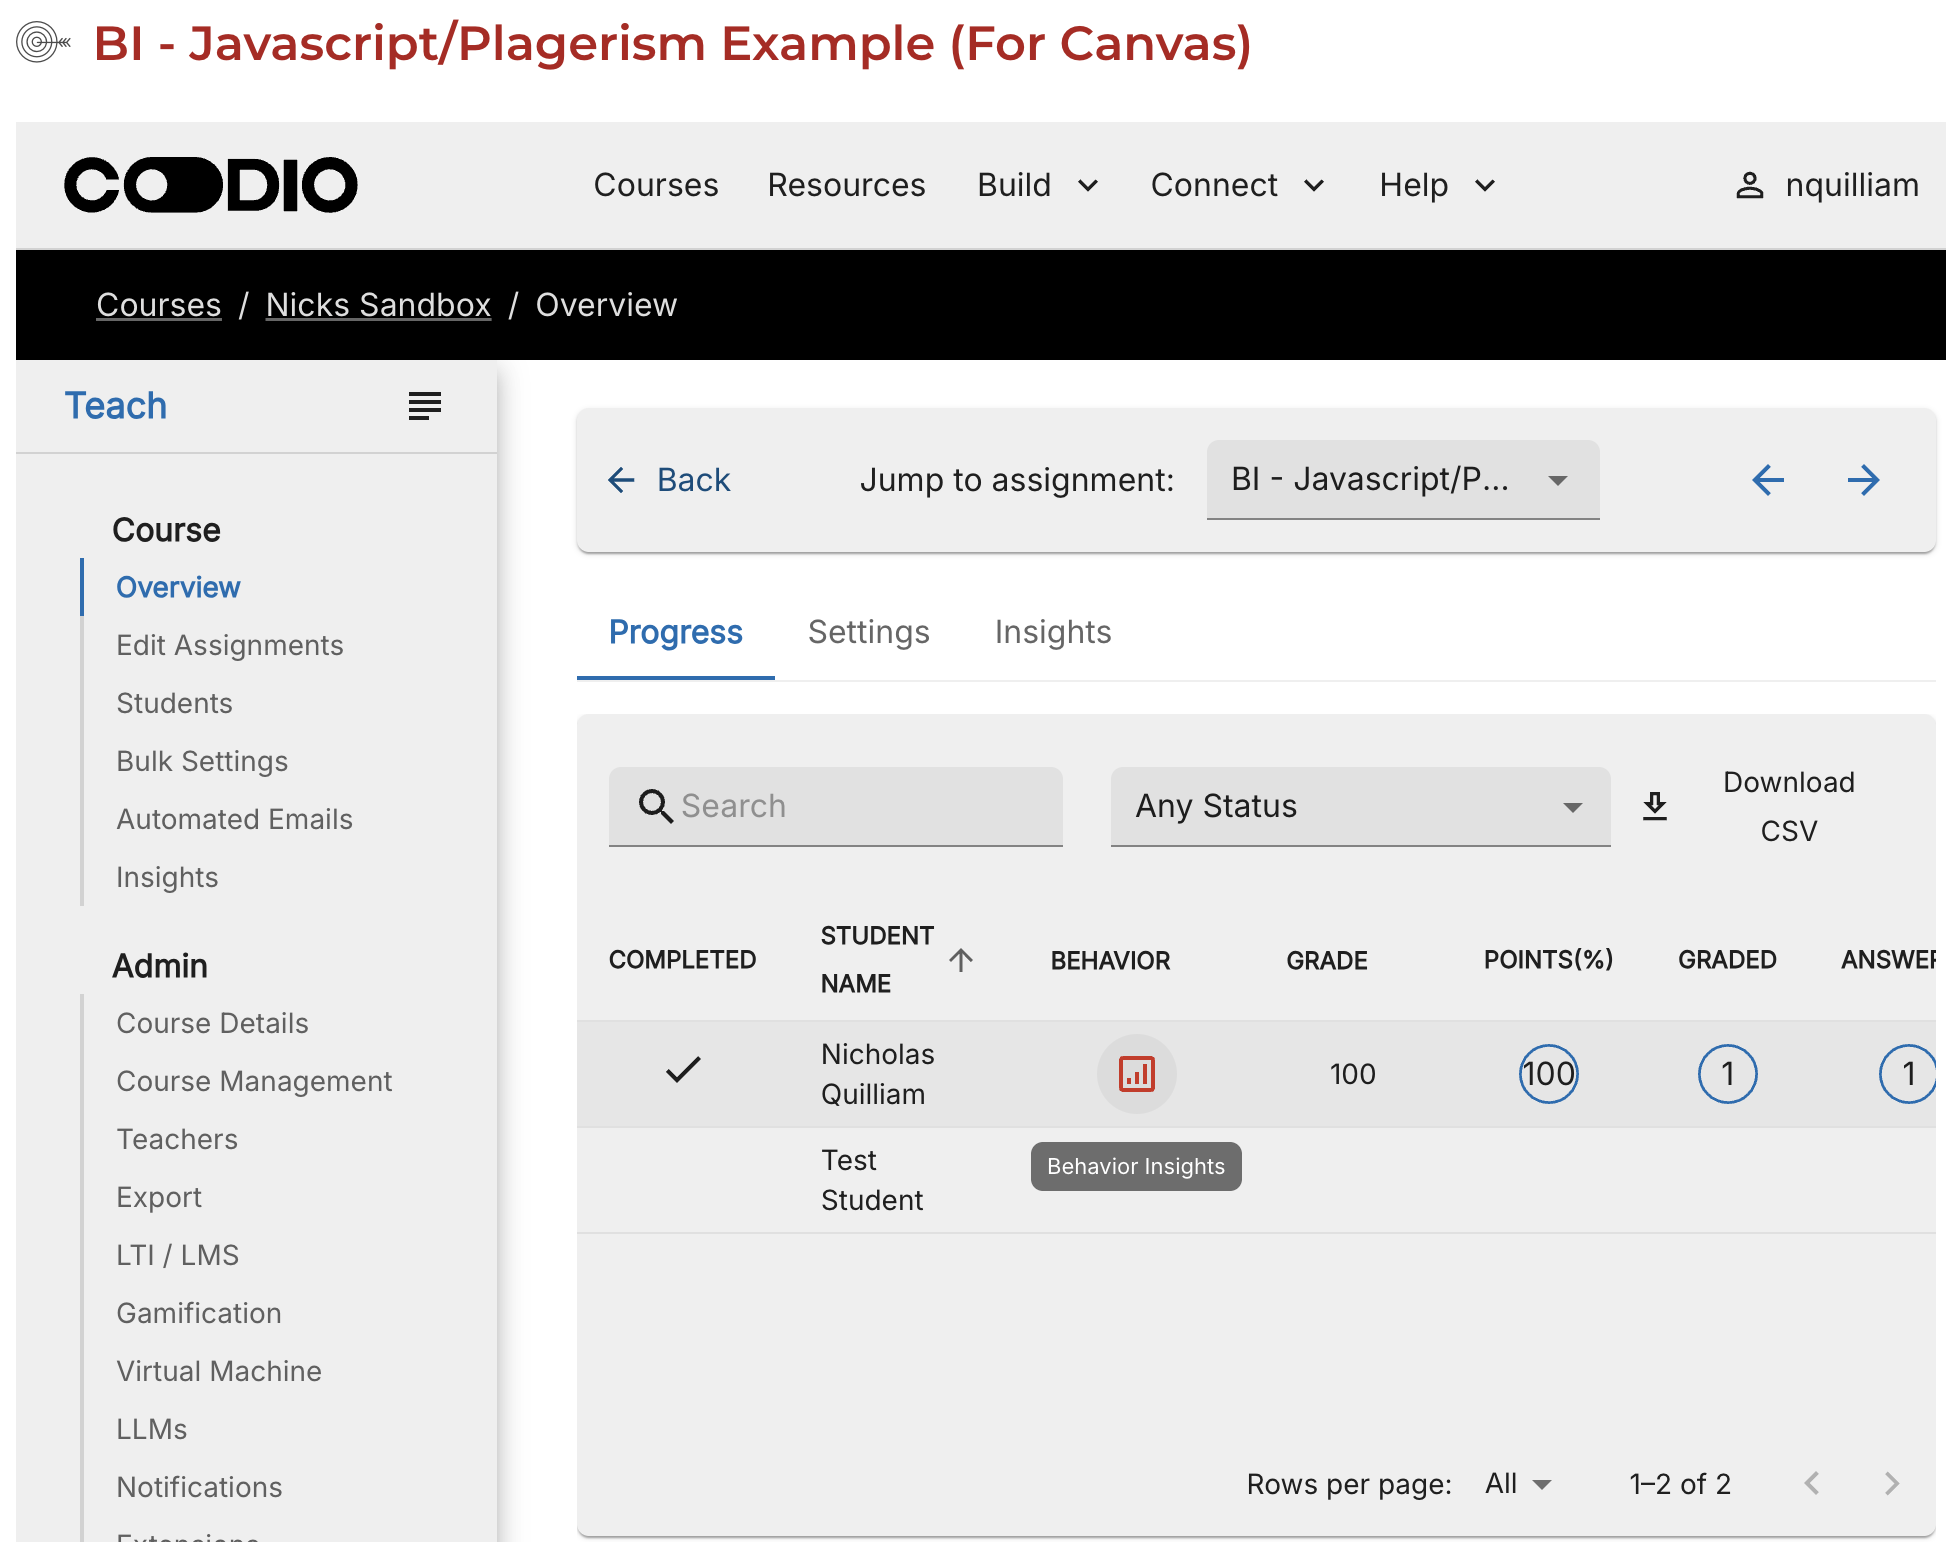
Figure 6 - Red behavior indicator; threshold exceeded, flagged for review
BI metrics
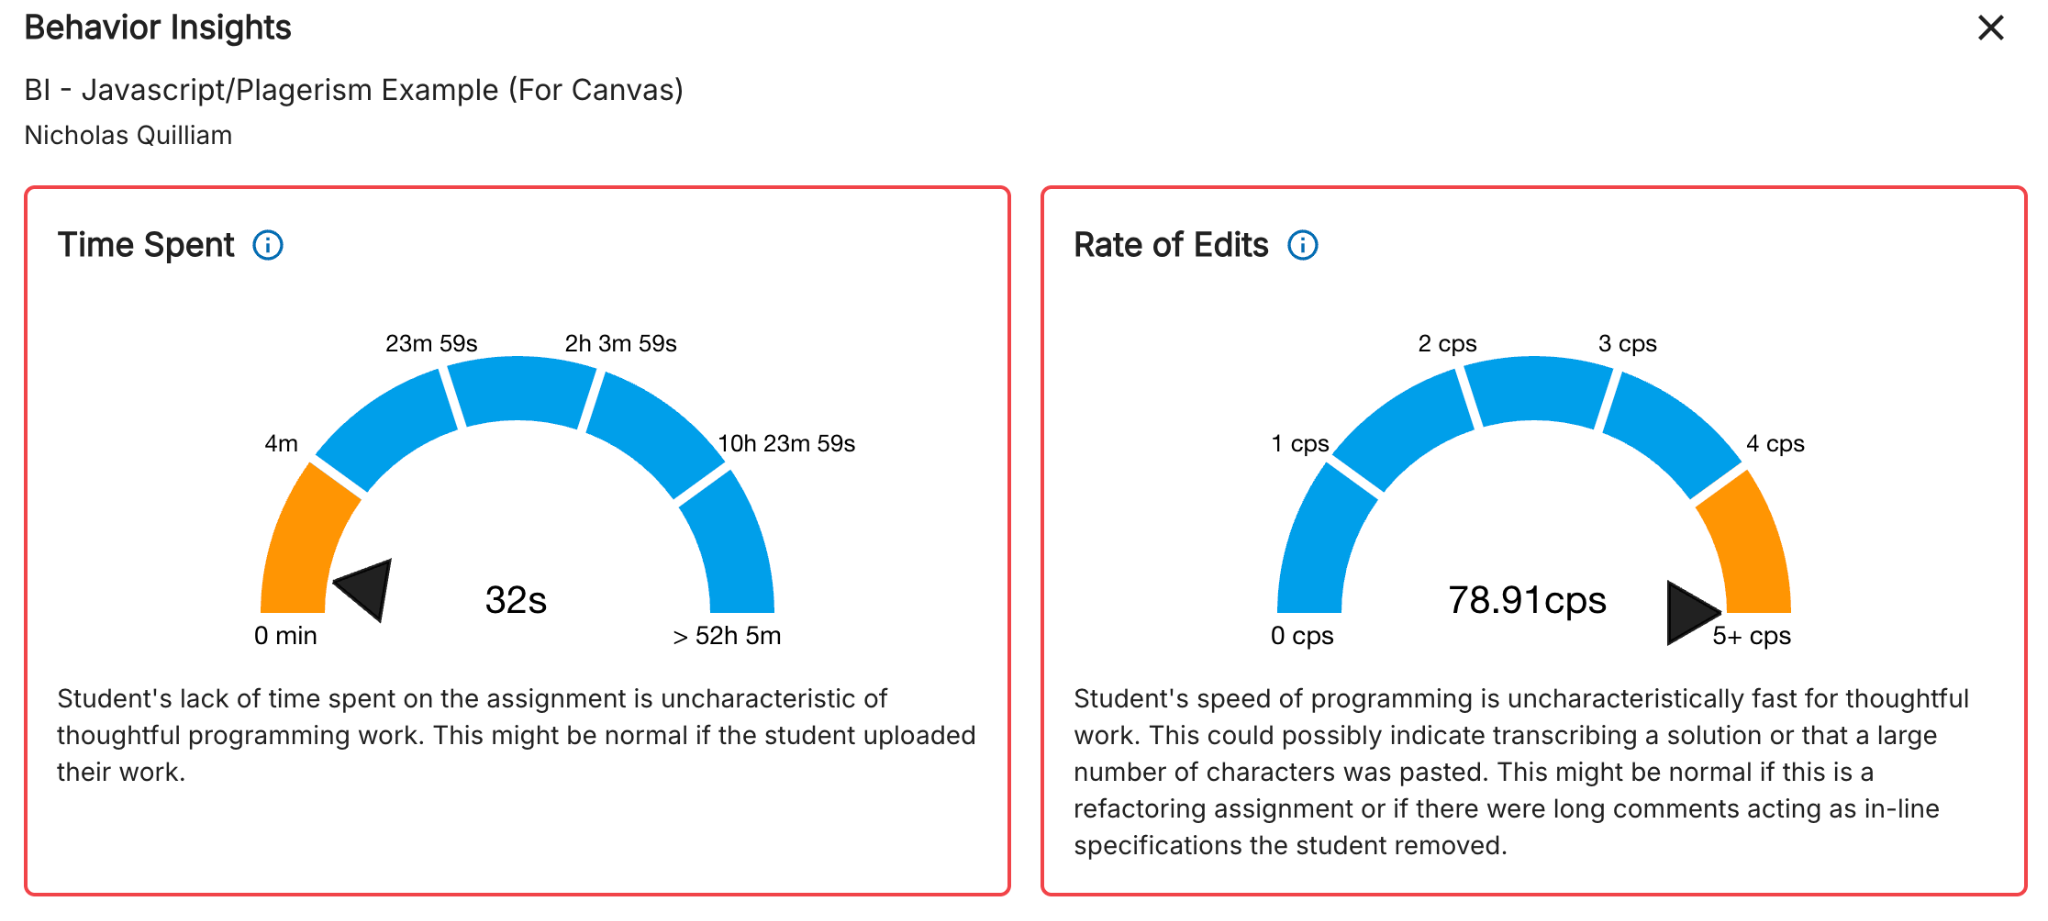
Figure 7 - Time Spent: 32 seconds. Rate of Edits: 78.91 cps
Both metrics fall in the red (flagged) zone. Time spent of 32 seconds is, per Codio's own explanatory text, "uncharacteristic of thoughtful programming work" (though this might be normal if the student uploaded prior work). A rate of 78.91 characters per second is, per Codio, "uncharacteristically fast for thoughtful work" and could indicate transcribing a solution or a large paste.
External paste evidence
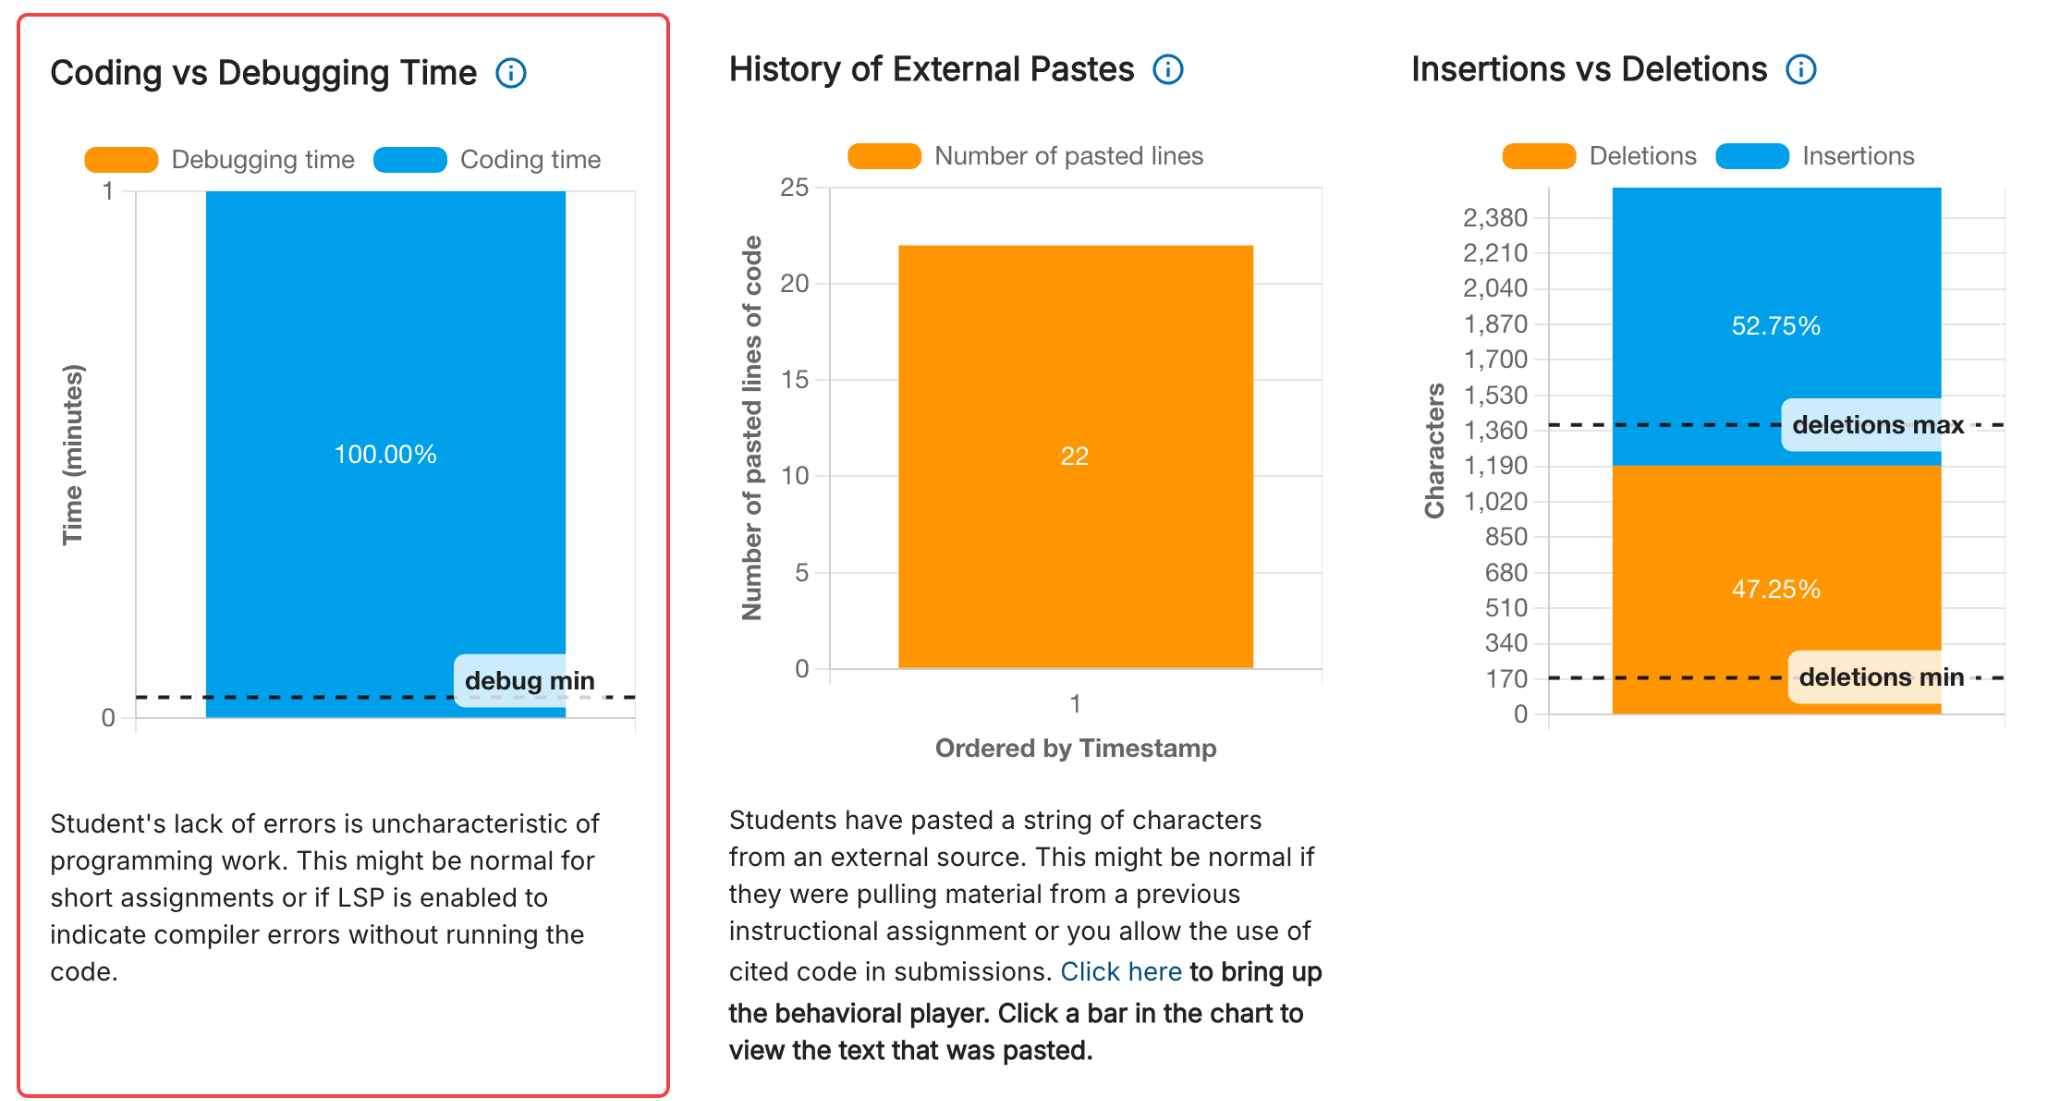
Figure 8 - Coding vs. debugging (100% coding, no debug time), 22 pasted lines, heavy insertions
The History of External Pastes chart shows 22 pasted lines in a single event - unlike the honest example, where this chart was empty. Combined with near-zero debug time and the gauge readings above, this is a strong combined signal.
Using BI for Plagiarism Review
What it tells you: BI flags students whose time-spent and edit-rate metrics fall outside expected ranges for the assignment. It is based only on data collected within the Codio environment for that specific unit.
What it doesn't tell you: It can't distinguish "pasted from another source dishonestly" from legitimate reasons a student's activity might look unusual, including:
- The student transferred cohorts or had their enrollment moved (e.g., a New York-to-another-state transfer), and pasted in work they'd already completed locally before the transfer.
- The student is retaking a unit and reused prior, legitimately-completed work.
- The student wrote code in an external editor (VS Code, etc.) and pasted it in - which may be common or even expected practice in some courses.
Recommended approach before flagging a student:
- Treat a BI flag as a prompt to look closer, not a conclusion.
- Check the behavioral player to see the actual paste/edit pattern.
- Consider whether the student could plausibly have transferred cohorts, retaken the unit, or worked in an external IDE before concluding anything.
- If raising this with a facilitator or in documentation/examples, anonymize identifying details (e.g., blur/redact student names in screenshots).
False Positives: JupyterLab & RStudio
BI's metrics rely on tracking keystrokes inside the native Codio IDE. When a unit uses JupyterLab or CodioStudio (RStudio) instead, that tracking doesn't capture activity the same way - so BI can show a red or orange flag on work that was actually done legitimately, simply because the data wasn't captured.
Example 3 - JupyterLab (False Positive)
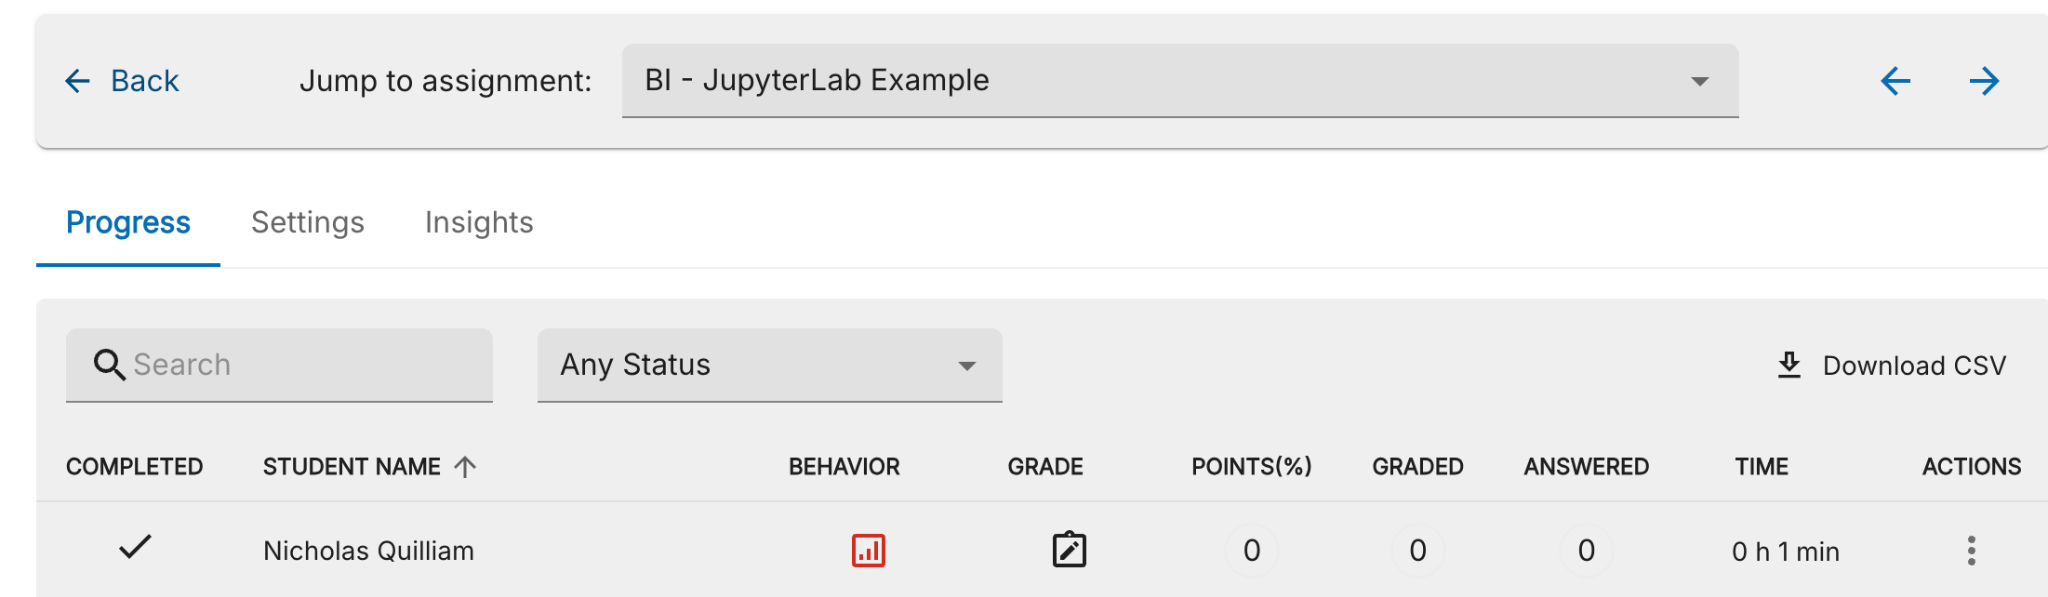
Figure 9 - Red indicator triggered on a JupyterLab assignment
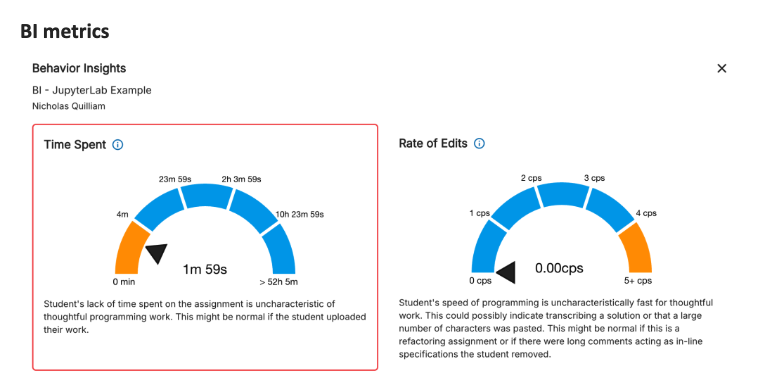
Figure 10 - Missing Edit Data

Figure 11 — There is no data to display" for coding/debugging time and insertions/deletions; explanatory text notes "Codio IDE buttons were not used to run code
Metrics are incomplete; behavior was legitimate.
Example 4 - RStudio / CodioStudio (False Positive)
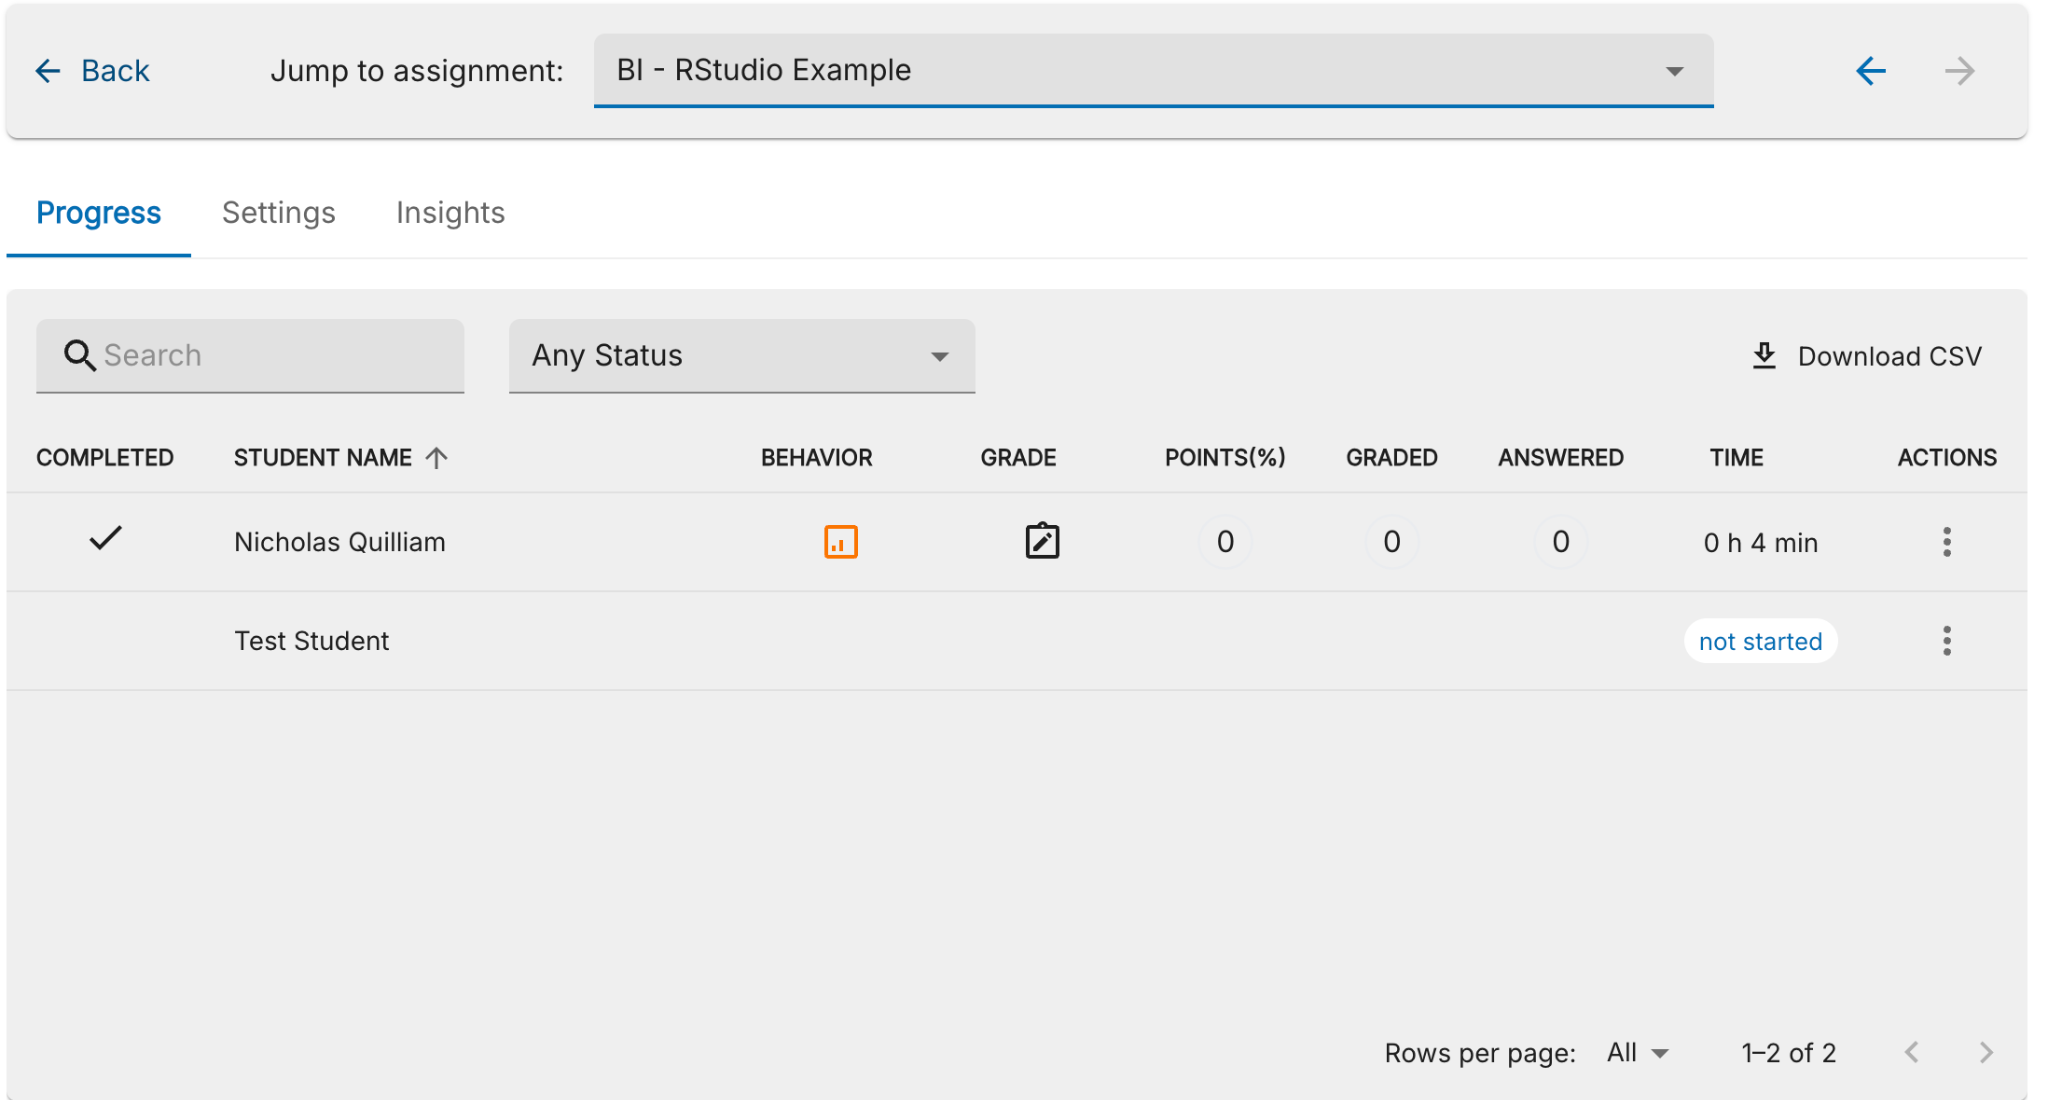
Figure 12 - Orange indicator on the Progress tab for an RStudio-based assignment
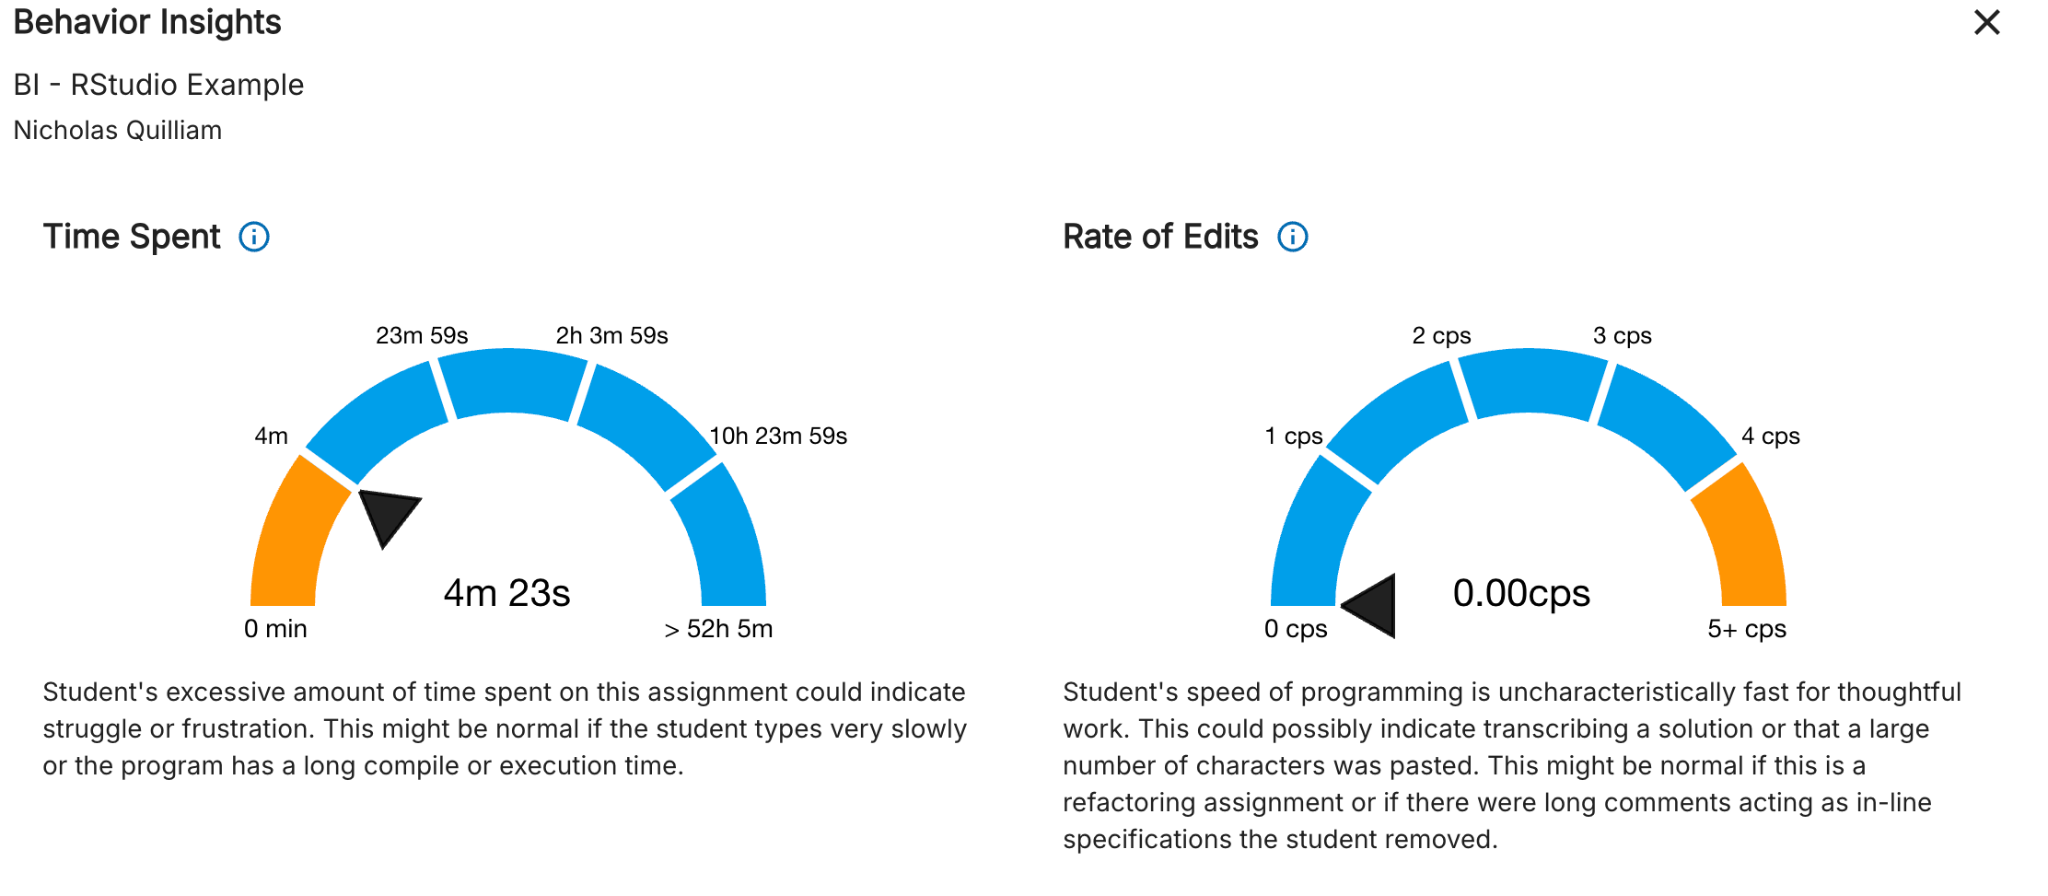
Figure 13 - Time Spent: 4m 23s (normal range). Rate of Edits: 0.00 cps
Time spent here looks normal, but rate of edits reads 0.00 cps - not because the student did nothing, but because CodioStudio/RStudio activity isn't captured by BI's edit-tracking the same way the base IDE is.
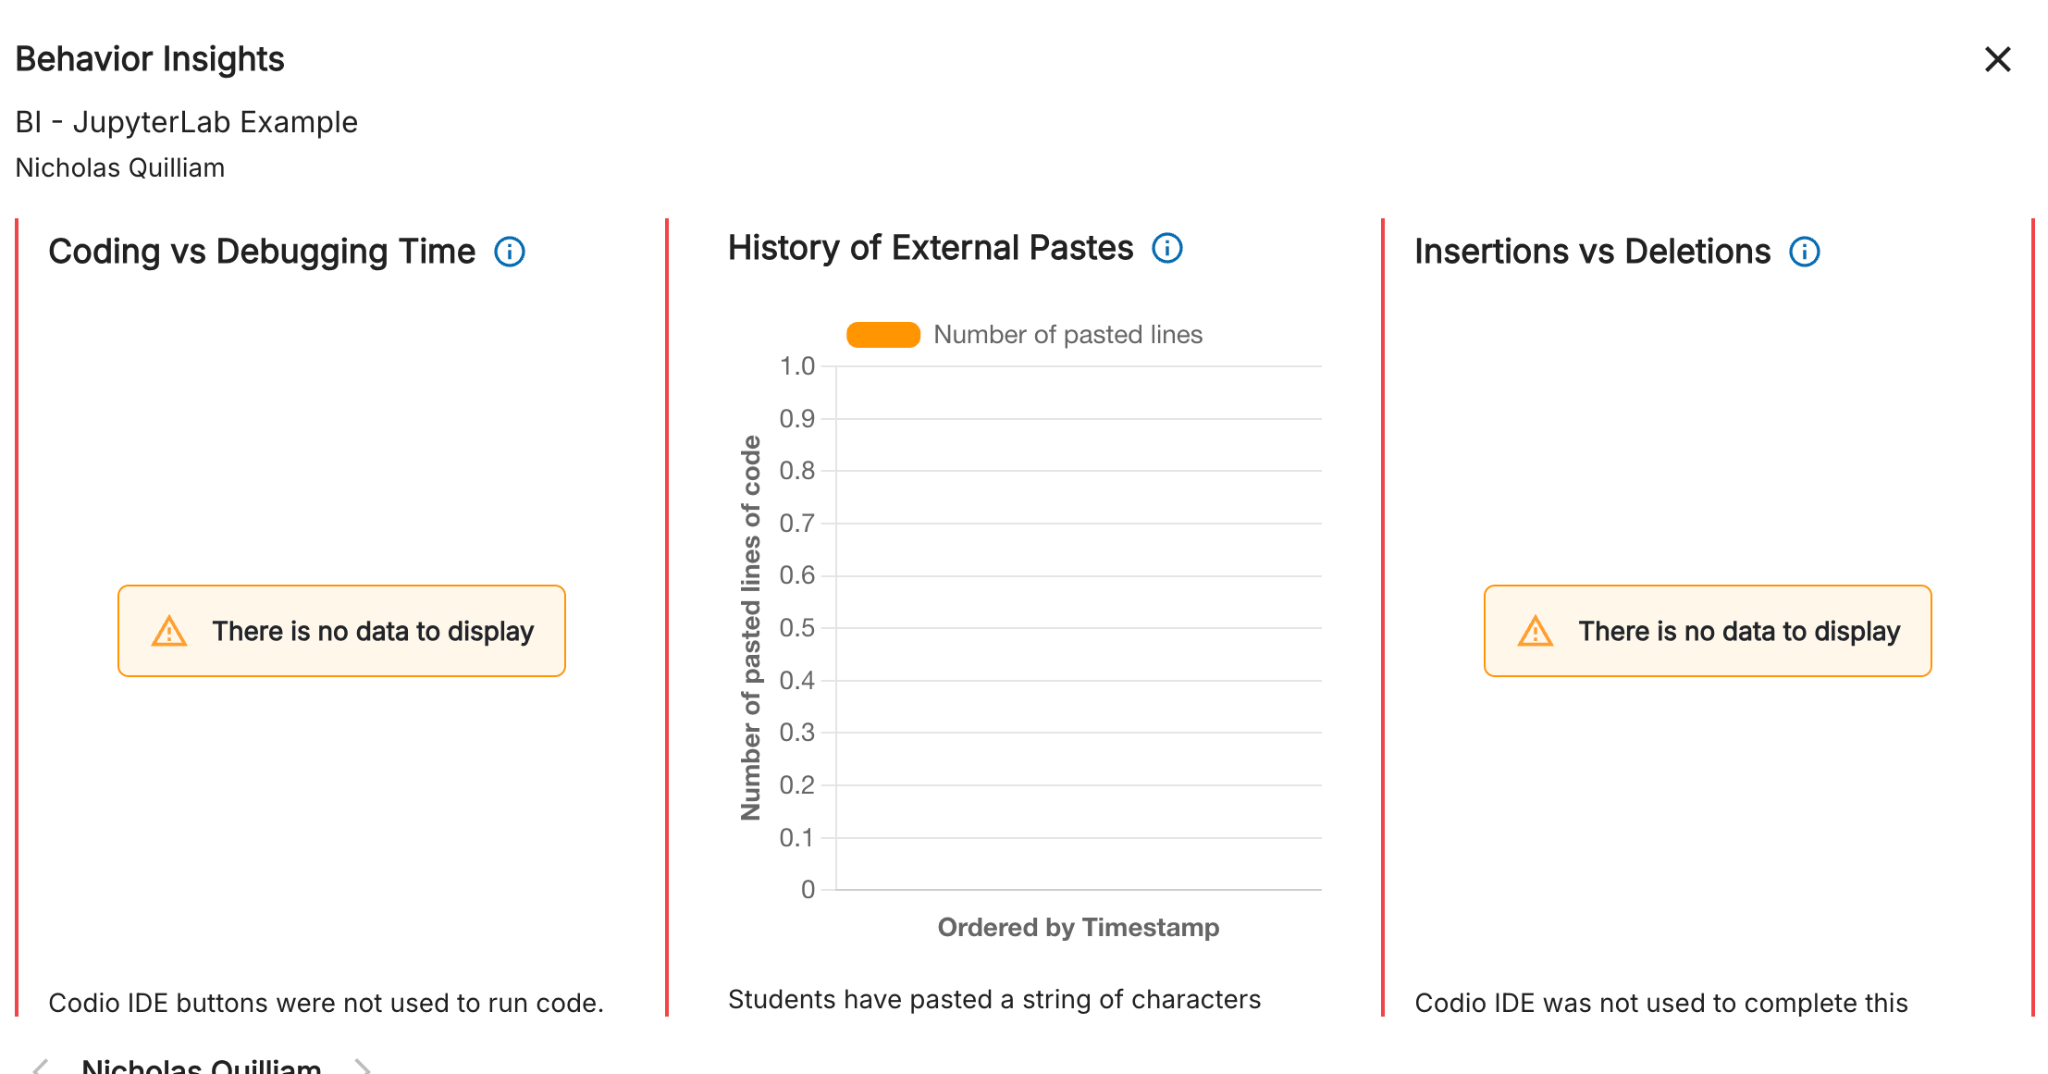
Figure 13 - "There is no data to display" panels for coding/debugging time and insertions/deletions on an RStudio assignment
Behavior Comparison Table
| Scenario | Time | Edit Behavior | Interpretation |
|---|---|---|---|
| Honest (native IDE) | Normal | Gradual edits | Independent work |
| Plagiarism (native IDE) | Very low | Extremely high cps | Likely pasted |
| JupyterLab | Low | No data captured | False positive |
| RStudio / CodioStudio | Normal | No data captured | False positive |